The concept of a graph is very simple to grasp, yet these mathematical objects are extremely varied. The specialized vocabulary for talking about graphs is most useful for trying to describe the various graphs and their properties.. Graphs are useful for modeling a wide variety of real-world situations.
Of course you can learn about graphs and their properties by studying them, but a much easier way to begin to understand them is by playing games.
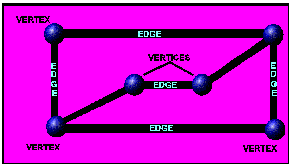
Each dot is called a vertex. The plural of vertex is vertices. (Although many excited young students experiencing graph games and puzzles for the first time use the word verticie as the singular of vertices!) The lines that connect the vertices are called edges. Edges can connect any or all of the vertices. Edges in a graph can cross one another without there being a vertex at the place where they cross, but edges cannot "hang loose" with no vertex on the very end.
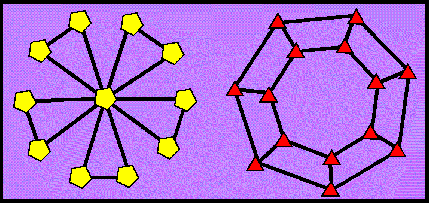
The edges of a graph can be stretched, shrunk, pulled out of place, or deformed in any imaginable way and it will still be the same graph. All of the different representations of the same graph, are said to be isomorphic to one another.
Sometimes it is not so easy to tell that two graphs are isomorphic. It takes quite a bit of moving edges around to see that the graphs above are isomorphic. In fact, no one knows a reliable way to quickly determine quickly if two graphs, no matter how large they are, are isomorphic--although it is fun to experiment with graphs to see if they are isomorphic.
.
One way mathematicians try to understand objects is in terms of their properties. The number 6, for instance, is a positive, even number divisible by 3 and less than 10. These are properties of the number 6. We could list many more. Depending on what you are trying to find out, some properties of the object you are looking at are more useful than others.
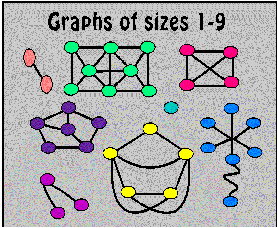
Three properties of graphs that are important in many problems are size, regularity, diameter.
The size of a graph is the number of vertices it has. A graph is regular if all of the vertices have the same degree. The degree of a vertex is the number of edges that touch it.
Mathematicians would use the term 3-regular to describe a graph in which all the vertices were of degree 3. 4-regular graphs have vertices of degree 4, and so on.
Just like the diameter of a circle measures the distance across a circle, diameter is a measure of distance between vertices in a graph. The idea of "distance" in a graph is different from the "distance" we commonly measure with a tape measure, however, because we can stretch or shrink the edges of a graph to be any length at all.
Imagine traveling from vertex to vertex along the edges of a graph. Each trip along one edge, no matter how long or short the edge happens to be, counts as one move. The distance from one vertex to another is the smallest number of moves that it takes to get there.
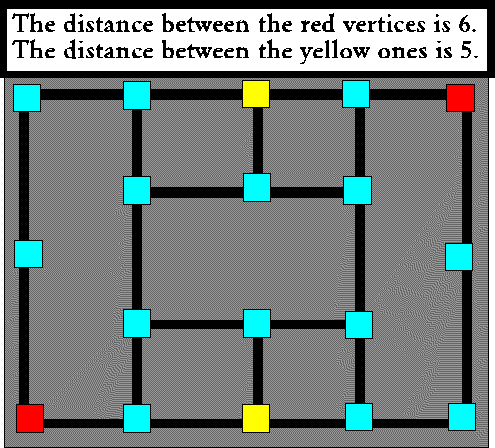
The diameter of a circle measures the distance between two points on the circle that are farthest apart. Similarly, the diameter of a graph is the distance between the two vertices of the graph that are farthest apart.
For example, imagine that you have been given the task of deciding how to link 12 computers together. Each one of these computers will use information that is generated by all the others, so that all of them will need to exchange information with each other. Unless each computer can be connected directly to all eleven of the other ones, the computers will have to interrupt the work that they are supposed to be doing just to relay messages. It would be nice if every computer could be connected to all of the others, but that can get expensive.
Suppose that each computer is made to be connected to only three others. Suppose further, that someone has figured out that the whole system can handle the traffic only if messages don't have to pass through more than two computers on their way to their destination. If messages have to pass through three or more computers, it is likely that the whole system will get bogged down because it is doing to much work just passing messages around. How will you decide how to plug these computers together?
When you try and solve such a problem, a good way to show these connections is with a graph. Draw the computers as vertices or dots and the connecting wires are edges or lines.
For this problem, ou will be trying to construct a graph that is 3-regular whose is not greater than three. With a little bit of experimentation, you can figure out how to connect all 12 computers so that these criteria are met.
Now suppose you are given a similar task, but instead of connecting computers, you have been asked to lay out where the electric impulses should go on a silicon chip. You are allowed to use only one side of the chip, because the other side of the chip is being used for something else. If any of your connections cross, the whole thing will short-circuit and be useless. It is quite a bit harder to find a way to draw the graph that represents the right set of connections.
This graph will be 3-regular and it's diameter will be 3, (just like the graph that you drew to connect the computers in the problem above) but it will have the additional property of being planar. That means that it can be drawn in a flat plane so that edges only touch each other at a vertex. If you can draw this graph without peeking at the the solution you should be triumphant! When you look at the solution, it is easy to verify that the graph is indeed 3-regular and planar. It may take some experimentation to verify that the diameter is also 3. Specifications about the relationship between degree and diameter in graphs occurs over and over again in questions that come up in computer system design.
The activities and stories wil help you do just that.
